It has been over a year since I posted Hacking Google Finance in Real-Time for Algorithmic Traders article. Surprisingly, it became the number one URL of QaR that Google has been displaying as a result to various queries and the number two most frequently read post. Thank You! It’s my pleasure to provide quality content covering interesting topics that I find potentially useful.
You can be surprised how fast Python solutions went forward facilitating life of quants and algo traders. For instance, yesterday, haphazardly, I found a code that seems to work equally well as compared to my first version, and, in fact, is more flexible in data content that could be retrieved. The idea stays the same as previously, however, our goal this time is to monitor changes of stock prices provided by Google Finance in real-time before the market opens.
Constructing Pre-Market Price-Series
The pre-market trading session typically occurs between 8:00am and 9:30am EDT each trading day though for some stocks we often observe frequent movements much earlier, e.g. at 6:00am. Many investors and traders watch the pre-market trading activity to judge the strength and direction of the market in anticipation for the regular trading session. Pre-market trading activity generally has limited volume and liquidity, and therefore, large bid-ask spreads are common. Many retail brokers offer pre-market trading, but may limit the types of orders that can be used during the pre-market period$^1$.
In Google Finance the stock price in pre-market is usually displayed right beneath the tricker, for example:
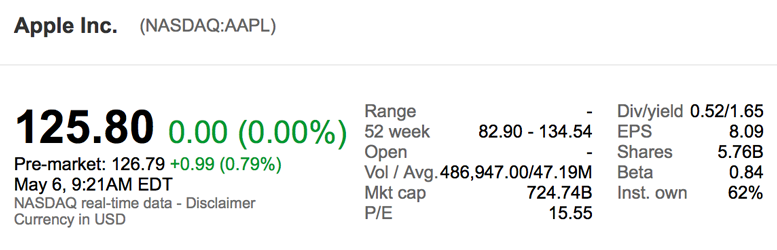
The price of the stock (here: AAPL) varies depending on interest, good/bad news, etc.
In Python we can fetch those changes (I adopt a code found on the Web) in the following way:
import urllib2  # works fine with Python 2.7.9 (not 3.4.+)
import json
import time

def fetchPreMarket(symbol, exchange):
    link = "http://finance.google.com/finance/info?client=ig&q="
    url = link+"%s:%s" % (exchange, symbol)
    u = urllib2.urlopen(url)
    content = u.read()
    data = json.loads(content[3:])
    info = data[0]
    t = str(info["elt"])    # time stamp
    l = float(info["l"])    # close price (previous trading day)
    p = float(info["el"])   # stock price in pre-market (after-hours)
    return (t,l,p)


p0 = 0
while True:
    t, l, p = fetchPreMarket("AAPL","NASDAQ")
    if(p!=p0):
        p0 = p
        print("%s\t%.2f\t%.2f\t%+.2f\t%+.2f%%" % (t, l, p, p-l,
                                                 (p/l-1)*100.))
    time.sleep(60)
In this code we target Google to get every 60 seconds an update of the pre-market price (line #14). What we retrieve is a JSON file of the form:
// [
{
"id": "22144"
,"t" : "AAPL"
,"e" : "NASDAQ"
,"l" : "125.80"
,"l_fix" : "125.80"
,"l_cur" : "125.80"
,"s": "1"
,"ltt":"4:02PM EDT"
,"lt" : "May 5, 4:02PM EDT"
,"lt_dts" : "2015-05-05T16:02:28Z"
,"c" : "-2.90"
,"c_fix" : "-2.90"
,"cp" : "-2.25"
,"cp_fix" : "-2.25"
,"ccol" : "chr"
,"pcls_fix" : "128.7"
,"el": "126.10"
,"el_fix": "126.10"
,"el_cur": "126.10"
,"elt" : "May 6, 6:35AM EDT"
,"ec" : "+0.30"
,"ec_fix" : "0.30"
,"ecp" : "0.24"
,"ecp_fix" : "0.24"
,"eccol" : "chg"
,"div" : "0.52"
,"yld" : "1.65"
,"eo" : ""
,"delay": ""
,"op" : "128.15"
,"hi" : "128.45"
,"lo" : "125.78"
,"vo" : "21,812.00"
,"avvo" : "46.81M"
,"hi52" : "134.54"
,"lo52" : "82.90"
,"mc" : "741.44B"
,"pe" : "15.55"
,"fwpe" : ""
,"beta" : "0.84"
,"eps" : "8.09"
,"shares" : "5.76B"
,"inst_own" : "62%"
,"name" : "Apple Inc."
,"type" : "Company"
}
]
You can download it individually if we execute in the browser a query:
http://www.google.com/finance/info?infotype=infoquoteall&q=NASDAQ:AAPL
Some of those information you can easily decipher. For our task we need to get only: el (an asset price in pre-market or after-hours trading; a.k.a. extended hours trading); elt (corresponding time stamp); and l (most recent last price). This is what our Python code does for us in lines #12-14. Nice and smoothly.
When executed before 9.30am EDT (here for NASDAQ:AAPL), we may construct the pre-market price-series every time the price has been changed:
May 6, 6:35AM EDT	125.80	126.18	+0.38	+0.30%
May 6, 6:42AM EDT	125.80	126.21	+0.41	+0.33%
May 6, 6:45AM EDT	125.80	126.16	+0.36	+0.29%
May 6, 6:46AM EDT	125.80	126.18	+0.38	+0.30%
May 6, 6:49AM EDT	125.80	126.10	+0.30	+0.24%
May 6, 6:51AM EDT	125.80	126.20	+0.40	+0.32%
May 6, 6:57AM EDT	125.80	126.13	+0.33	+0.26%
May 6, 7:00AM EDT	125.80	126.20	+0.40	+0.32%
May 6, 7:01AM EDT	125.80	126.13	+0.33	+0.26%
May 6, 7:07AM EDT	125.80	126.18	+0.38	+0.30%
May 6, 7:09AM EDT	125.80	126.20	+0.40	+0.32%
May 6, 7:10AM EDT	125.80	126.19	+0.39	+0.31%
May 6, 7:10AM EDT	125.80	126.22	+0.42	+0.33%
May 6, 7:12AM EDT	125.80	126.20	+0.40	+0.32%
May 6, 7:22AM EDT	125.80	126.27	+0.47	+0.37%
May 6, 7:28AM EDT	125.80	126.24	+0.44	+0.35%
...
May 6, 9:02AM EDT	125.80	126.69	+0.89	+0.71%
May 6, 9:03AM EDT	125.80	126.71	+0.91	+0.72%
May 6, 9:04AM EDT	125.80	126.73	+0.93	+0.74%
May 6, 9:08AM EDT	125.80	126.67	+0.87	+0.69%
May 6, 9:09AM EDT	125.80	126.69	+0.89	+0.71%
May 6, 9:10AM EDT	125.80	126.68	+0.88	+0.70%
May 6, 9:13AM EDT	125.80	126.67	+0.87	+0.69%
May 6, 9:14AM EDT	125.80	126.72	+0.92	+0.73%
May 6, 9:16AM EDT	125.80	126.74	+0.94	+0.75%
May 6, 9:17AM EDT	125.80	126.72	+0.92	+0.73%
May 6, 9:18AM EDT	125.80	126.70	+0.90	+0.72%
May 6, 9:19AM EDT	125.80	126.73	+0.93	+0.74%
May 6, 9:20AM EDT	125.80	126.75	+0.95	+0.76%
May 6, 9:21AM EDT	125.80	126.74	+0.94	+0.75%
May 6, 9:21AM EDT	125.80	126.79	+0.99	+0.79% (*)
May 6, 9:23AM EDT	125.80	126.78	+0.98	+0.78%
May 6, 9:24AM EDT	125.80	126.71	+0.91	+0.72%
May 6, 9:25AM EDT	125.80	126.73	+0.93	+0.74%
May 6, 9:26AM EDT	125.80	126.75	+0.95	+0.76%
May 6, 9:27AM EDT	125.80	126.70	+0.90	+0.72%
May 6, 9:28AM EDT	125.80	126.75	+0.95	+0.76%
May 6, 9:29AM EDT	125.80	126.79	+0.99	+0.79%
Since the prices in pre-market tend to vary slowly, 60 second time interval is sufficient to keep our eye on the stock. You can compare a live result retrieved using our Python code at 9:21am (*) with the above screenshot I took at the same time.
A simple joy of Python in action. Enjoy!
HOMEWORK
1. The code fails after 9.30am EST (NYC time). Modify it to catch this exception.
2. Modify the code (or write a new function) that works after 9.30am EDT.
3. It is possible to get $N\gt1$ queries for $N$ stocks by calling, for example:
NASDAQ:AAPL,NYSE:JNJ,… in line #7 of the code. Modify the program
to fetch pre-market time-series, $x_i(t)$ $(i=1,…,N)$, for $N$-asset portfolio.
Given that, compute a fractional root-mean-square volatility, $\sigma_{x_i(t)}/\langle x_i(t) \rangle$,
i.e. standard deviation divided by the mean, between 6am and 9.30am EDT
for each asset and check can you use it as an indicator for stock price movement
after 9.30am? Tip: the higher frms the more trading is expected in first 15 min
of a new session at Wall Street.
4. Modify the code to monitor after-hours trading till 4.30pm.
RELATED POSTS
Hacking Google Finance in Real-Time for Algorithmic Traders
REFERENCES
$^1$Pre-Market, Investopedia, http://www.investopedia.com/terms/p/premarket.asp
9 comments
You do not maybe have a PHP example of this?
Unfortunately not.
Hi Powel, Great blog. I am pleasantly surprised by the amount of useful info on this page (something quiet rare in the financial world). Is there a way to pull volume data from google finance ? something that is the equivalent of /finance/getprices?q=…. ?
Hi, thanks for sharing your Code!
I have a question: line 12 gives me a ” KeyError: ‘elt’ ”
Do you know how to fix that?
Hi Pawel, although the code works wonderfully, officially the Google Finance API is depracated (and would have been discontinued in October 2012, which obviously hasn’t been done yet). At various forums around the web people suggest to use Yahoo’s finance API instead of Google’s. Did you consider the use of Yahoo’s Finance API instead of Google’s? If so, what made you choose for Google’s?
Thanks for your comment, Koos! I had no obvious reasons to choose Google’s API. It’s just a working alternative to Yahoo!’s API. And if you have an alternative you have more freedom to act. I do not judge. I do not promote. Yahoo!’s API is easy to use with pandas, for instance. As long as data “quality” is not the greatest issue and the data are solely used for new algorithms, model backtesting, or educational purposes (what I like to do), we can sleep well. If you intend to do serious trading, of course, you go for serious solutions and data providers.
Thanks for your rapid reply, Pawel! Of course, the ‘serious solutions’ are obviously preferable for serious trading. I was just wondering how the Google Finance API worked, and as I delved in wondered why it still worked. But indeed, the main point is to get the thing working quickly – if it needs to be solid & reliable for a longer time, I’d have to turn to other services anyhow. Thanks for pointing out!
Hello,
interesting article but you might have a look a python-requests http://docs.python-requests.org/en/latest/
You can also add very easily cache mechanism using requests-cache http://requests-cache.readthedocs.org/en/latest/
Femto
Awesome! Thanks a lot. Always great to learn something new :)