Nearly every quarter the number of crypto-exchanges offering Bitcoin trading increases. At the moment there is at least 103 of them! Yes, you can buy or sell Bitcoin choosing one of 103 crypto-exchanges! This is insane but true. Intuitively one can assume that Bitcoin price should move up or down in the same direction regardless of the exchange you pick up for trading. There is no logical reason to think differently, right?!
In this article we will show how the expectations do not align with reality. We will write a handy code to analyse hourly Bitcoin price-series for Top Tier 20 crypto-exchanges and produce statistics revealing that there is a quasi-constant ratio of ca. 20% of the Bitcoin prices traded within 24 hours that are in the opposite direction. Our results may suggest the existence of the arbitrage opportunities and making money solely by trading Bitcoin at the selected crypto-exchanges. Where to trade BTC in the opposite direction to profit from it, will follow.
1. Gathering Data for Analysis
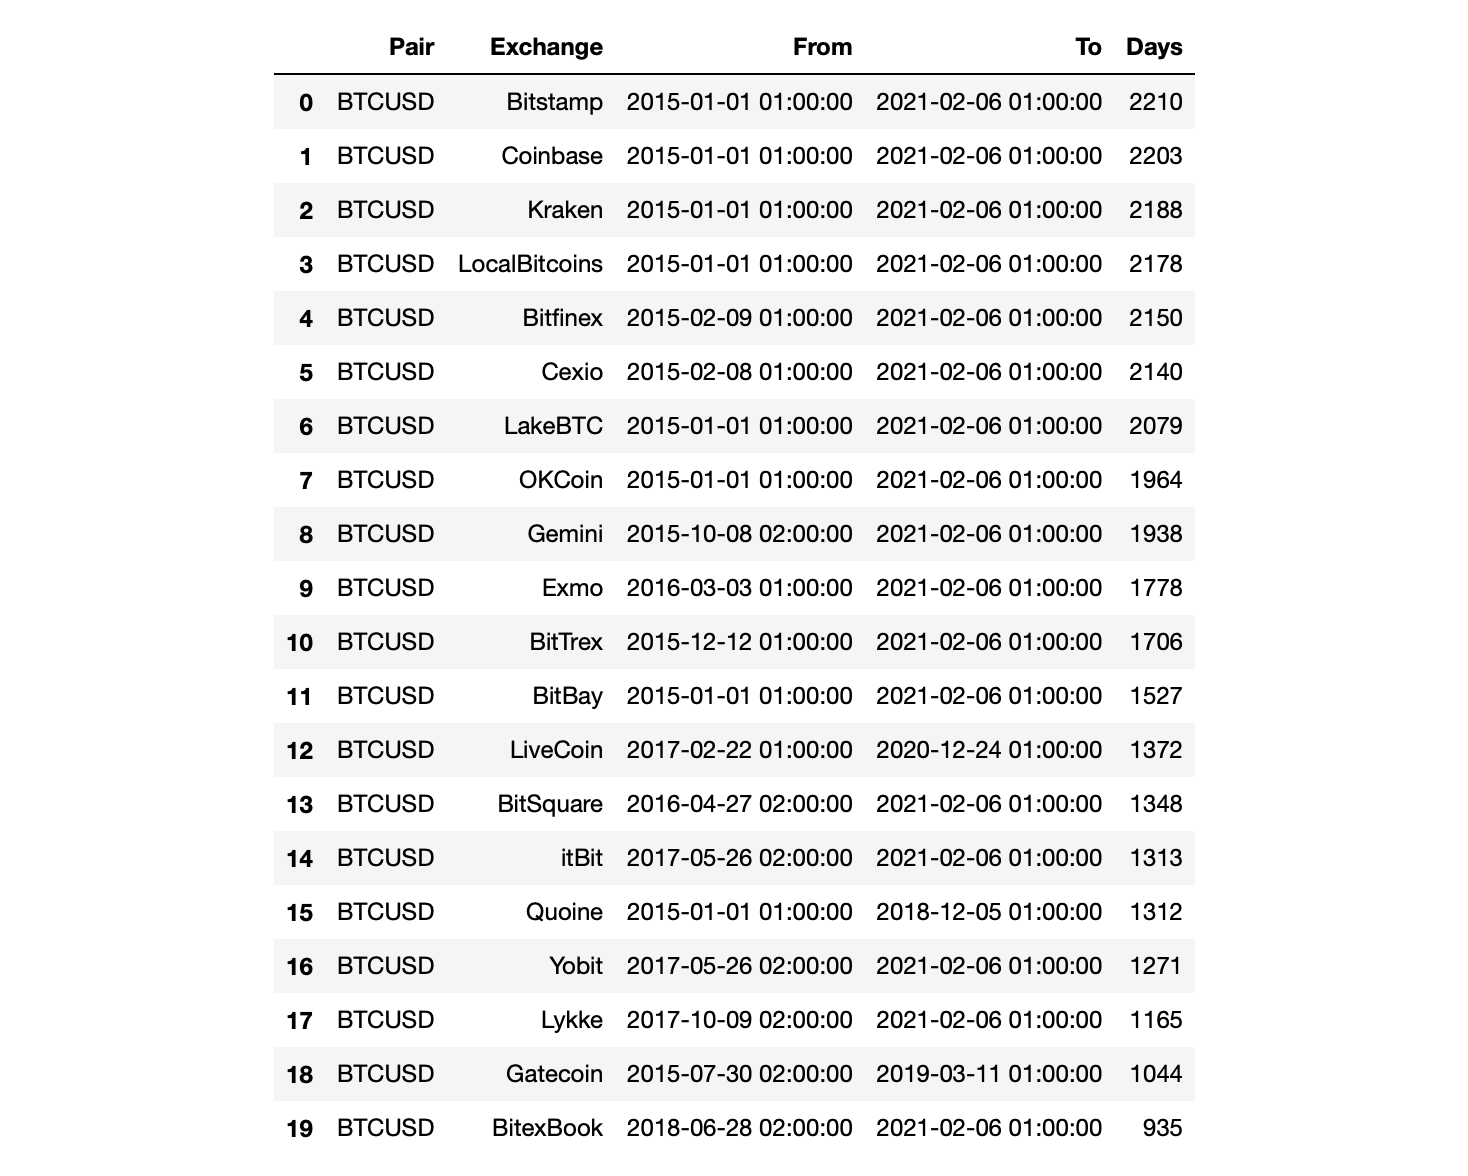
First, let’s collect the information on all crypto-exchanges where Bitcoin has been traded, since when, till when:
# Crypto vs Fiat Currency: (2) Does Bitcoin Always Co-Move at All Crypto-Exchanges?
#
# by Pawel Lachowicz, (c) 2021 QuantAtRisk.com

from IPython.core.display import display, HTML
display(HTML("<style>.container { width:90% !important; }</style>"))

import ccrypto as cc
import numpy as np
import matplotlib.pyplot as plt
import pandas as pd
import requests
import json
from bs4 import BeautifulSoup
import pickle

btcexch = cc.findexchange4crypto(ccy1='BTC', ccy2='USD')
btcexch = btcexch[btcexch.From < '2020-01-01']  # apply filter
btcexch = btcexch.sort_values(['Days'], ascending=False)  # sort DataFrame by 'Days'
btcexch.reset_index(inplace=True, drop=True)

# get a list of top 20 tier crypto-exchanges
top20exch = exch.Exchange[0:20].tolist()
display(btcexch.head(20))
where we have used a function findexchange4crypto returning basic information we are interested in. The results are further sorted according to the last column in order to determine the exchange at which Bitcoin was traded for the longest period of time. The list of top 20 tier crypto-exchanges, as at the moment of writing, is:

In the next step, we will create a local database (a Python dictionary) storing hourly prices-series of BTC for all above-identified top 20 crypto-exchanges covering an exemplary period of BTC in its bull run, i.e. from 2020-03-13 till 2021-01-09:
# data download
database = {}
for ex in top20exch:
    print(ex + '...', end=" ")
    try:
        database[ex] = cc.getCryptoSeries('BTC', 'USD', freq='h', exch=ex,
                                          start_date='2020-03-13',
                                          end_date='2021-01-09')
        print('downloaded')
    except:
        print('unsuccessful')

# save dictionoary with time-series in a file (binary format)
with open('btc_top20exch.db', 'wb') as handle:
    pickle.dump(database, handle)
Bitstamp... downloaded
Coinbase... downloaded
Kraken... downloaded
LocalBitcoins... downloaded
Bitfinex... downloaded
Cexio... downloaded
LakeBTC... downloaded
OKCoin... downloaded
Gemini... downloaded
Exmo... downloaded
BitTrex... downloaded
BitBay... downloaded
LiveCoin... downloaded
BitSquare... downloaded
itBit... downloaded
Quoine... downloaded
Yobit... downloaded
Lykke... downloaded
Gatecoin... downloaded
BitexBook... downloaded
You can upload these time-series from the file as follows:
# load time-series from database
with open('btc_top20exch.db', 'rb') as handle:
    ts = pickle.load(handle)

exchanges = list(ts.keys())
print(exchanges)
['Bitstamp', 'Coinbase', 'Kraken', 'LocalBitcoins', 'Bitfinex', 'Cexio', 'LakeBTC', 'OKCoin',
'Gemini', 'Exmo', 'BitTrex', 'BitBay', 'LiveCoin', 'BitSquare', 'itBit', 'Quoine', 'Yobit',
'Lykke', 'Gatecoin', 'BitexBook']
where the list of dictionary’s keys stores a simple list of the exchanges which we used to store DataFrames with price-series.
Since there is no guarantee that Bitstamp (number one in our list of top 20 crypto-exchanges) also has the greatest number of hourly records of the Bitcoin price, it would be nice to determine which exchange it does. A quick check we perform by executing:
fi = True
for ex in exchanges:
    n = ts[ex].shape[0]
    print(ex, n)
    if fi:
        n_max = n
        e = ex
        fi = False
    else:
        if n > n_max:
            n_max = n
            e = ex

print()
print(e, n_max)  # crypto-exchange with the greatest number of hourly BTC records
Bitstamp 7171
Coinbase 7170
Kraken 6794
LocalBitcoins 6958
Bitfinex 6511
Cexio 6770
LakeBTC 6933
OKCoin 7187
Gemini 7171
Exmo 7051
BitTrex 7174
BitBay 2259
LiveCoin 6532
BitSquare 4193
itBit 6319
Quoine 1
Yobit 5539
Lykke 1805
Gatecoin 1
BitexBook 7161

OKCoin 7187
It occurs that Bitstamp has 7171 data points while the greatest number of BTC hourly close prices has OKCoin exchange (7187). Let’s remove the latter from the exchanges list for the following purpose:
exchanges.remove(e)

df = ts[e]
df.columns = [e]
df.index = pd.to_datetime(df.index)

# merge all BTC price-series by crypto-exchange
for ex in exchanges:
    tmp = ts[ex]
    tmp.columns = [ex]
    tmp.index = pd.to_datetime(tmp.index)
    df = pd.merge(left=df, right=tmp, how='left', left_index=True, right_index=True)

display(df)

Here, we applied left join of all time-series by picking up the time-series belonging to OKCoin exchange. Because it contains the greatest number of hourly records, applying ‘left join’ using pandas’ merge function as defined above (see line #77), the function joins the series (in a loop, one by one), leaving missing common prices as marked by NaN in the resulting DataFrame (df).
2. Hourly Direction of Bitcoin Trading per Crypto-Exchange
The easiest way to determine an hourly direction of trading for selected Bitcoin price-series can be found by the calculation of an hourly rate of return (simple returns). In Python we achieve that as follows:
ret = df.pct_change(periods=1) # simple hourly returns

# create and apply a 'NaN' mask
mask = df.isna()
ret[mask] = np.nan

ret.dropna(how='all', axis=0, inplace=True)
display(ret)

We have creates a simple boolean mask which we applied to ret DataFrame. The reason was to keep an information on these positions where rates of return based on the use of pct_change(periods=1) function were 0 (they should be non-defined). As we will see in a moment, it can be useful in further analysis.
3. Co-Movements in Hourly Bitcoin Trading
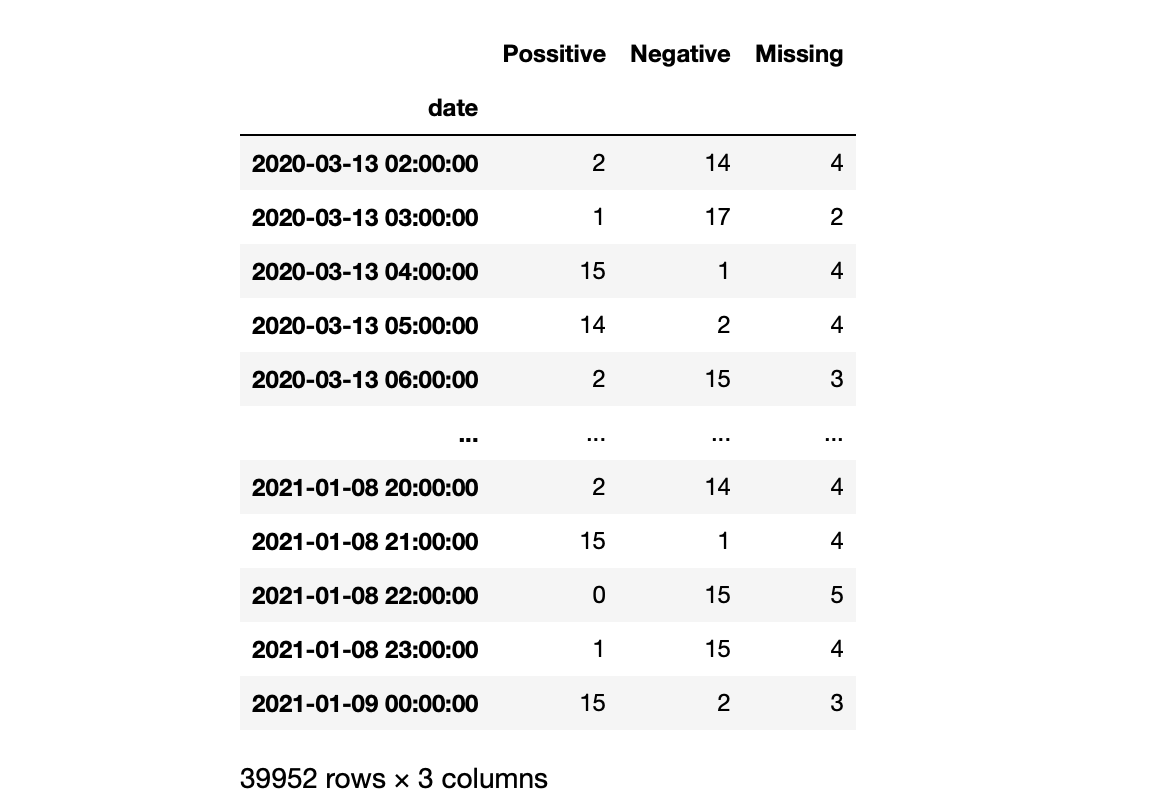
Given ret DataFrame, we can find for all timestamps the number of positive, negative, and missing hourly simple returns:
p = (ret >= 0).sum(axis=1)
n = (ret < 0).sum(axis=1)
m = (ret.isna()).sum(axis=1)

stats = pd.concat([p, n, m], join='outer', axis=1)
stats.columns = ['Possitive', 'Negative', 'Missing']

display(stats)
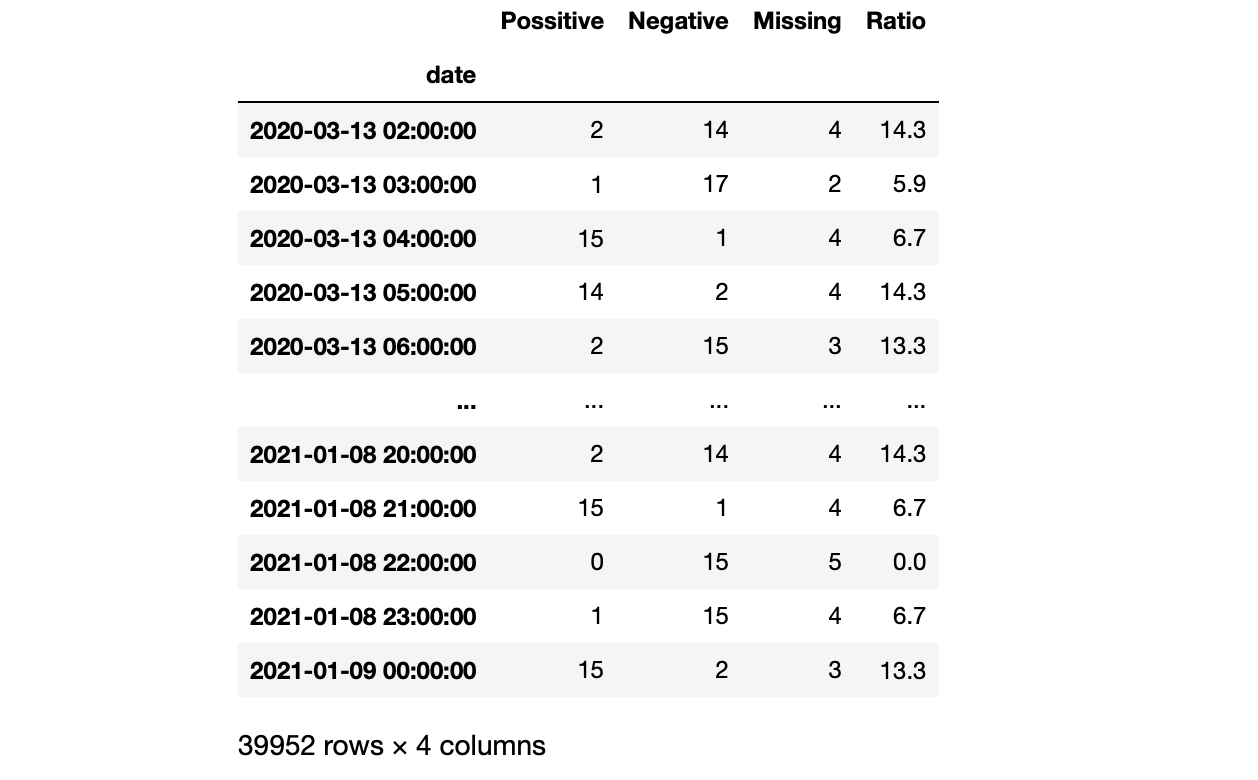
Intuitively, for each timestamp, the Bitcoin should co-move in the same direction. Obviously, it is not the case for our selection of top 20 tier crypto-exchanges. We can define a supplementary ratio which assumes that BTC moves up or down in the same hour if the price moves up or down at the majority of exchanges:
def ratio(z):
    x, y = z[0], z[1]
    if x > y:
        return np.round(y/x*100,1)
    elif y > x:
        return np.round(x/y*100,1)
    else:
        return np.NaN

stats['Ratio'] = stats[['Possitive', 'Negative']].apply(ratio, axis=1)
display(stats)
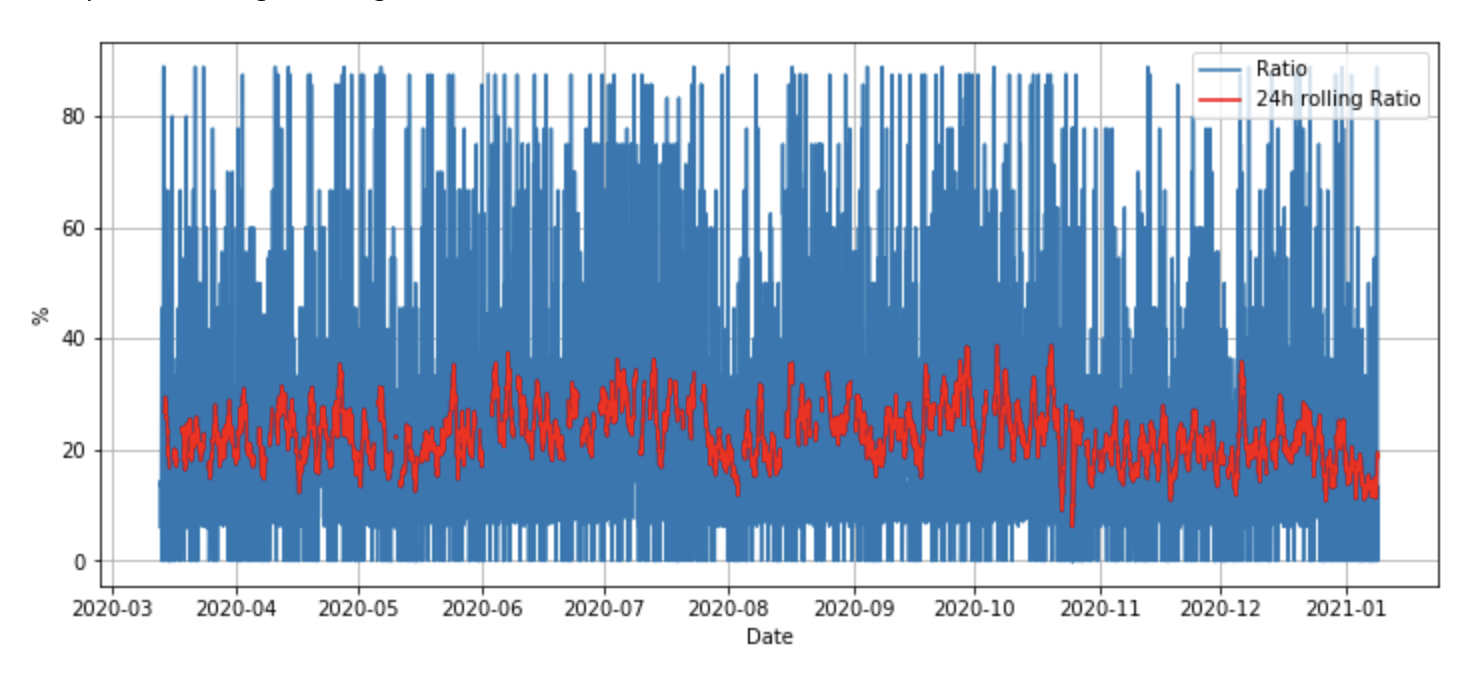
By plotting ‘Ratio’ along the time axis,
plt.figure(figsize=(12,5))
plt.grid()
plt.plot(stats.Ratio, label='Ratio')
plt.plot(stats.Ratio.rolling(24).mean(), 'r', label='24h rolling Ratio')
plt.xlabel('Date')
plt.ylabel('%')
plt.legend()
we are coming with a quite surprising and unexpected result:

This chart indicates the existence of quasi-constant ratio of ca. 20% of the Bitcoin prices traded within 24 hours that are in the opposite direction! You may ask “How come?!” A good question. The most probable explanation of this phenomenon is related to exchange-specific liquidity issues as well as delays in transaction settlements. If you are interested in diving deeper, it is a perfect time to jump in.
In the next, third part in this series we will develop further code to identify these exchanges where betting on Bitcoin moving in opposite directions can help you to earn some profits. Stay tuned!
DOWNLOADABLES
btc_top20exch.db (1.8 MB)

