In crypto market, stablecoins are meant to maintain their constant value with respect to the underlying currency. At least in theory. The problem begins with an idea of stablecoin’s value to be stable or being stabilised over time.
Different backup mechanisms are at work. For example, Tether tokens are called stablecoins because they offer price stability as they are pegged at 1-to-1 to a fiat currency (e.g. 1 USD₮ = 1 USD). For the latter, USD Tether (USD₮) is backed 100% by Tether’s reserves. For other stablecoins e.g. USD Coin (USDC), Binance USD (BUSD), TrueUSD (TUSD), Dai (DAI), Paxos (PAX), Ampleforth (AMPL), Synthetix (SNX) their value is backed by reserves or collaterals.
In reality, it occurs that stablecoins are extremely rarely stable, i.e. they offer very low volatility instead of rigid 1:1 ratio. If so, the question arises: what is the probability that within next 365 days we are lucky enough to observe an exact 1:1 peg in trading of the stablecoin vs fiat currency? Here, with a help comes the concept of negative hypergeometric distribution.
1. Negative Hypergeometric Distribution
It’s one of these peculiar discrete random number distributions that can be met in the textbooks on applied statistics, sporadically used if ever! Typically the story tells that a manufacturer has a lot of, say, 500 items, 50 of which are special. The items are inspected one at a time until 10 of the special items have been found. If the inspected items are not replaced in the lot, the random variable representing the number of special items found leads to the negative hypergeometric distribution.
Using the language of science, we say that suppose the lot of $N$ items contains $k$ special item. We wish to sample, without replacement, until we find $c$ of the special items. Then the sampling process stops. $Y$ is then the random variable denoting the number of trials necessary to detect $c$ items. Since the first $y-1$ trials comprise a hypergeometric process and the last trial must find a special item, then:
$$
P(Y=y) = \frac{ {k\choose {c-1}} {{N-k}\choose {y-c}} } { N\choose {y-1} } \cdot \frac{k-(c-1)}{N-(y-1)}, \ \ y = c, c+1, …, N-(k-c)
$$ what can be reduced down to
$$
P(Y=y) = \frac{ {{y-1}\choose {c-1}} {{N-y}\choose {k-c}} } { N\choose k },\ \ y = c, c+1, …, N-(k-c) \ \ .
$$ Please note that the process can end in as few as $c$ trials. The maximum number of trials must occur when the first $N-k$ trials contain all the non-special items followed by all $c$ special items. One can show that the expected value and the variance of the negative hypergeometric is,
$$
E(Y) = \frac{c(N+1)}{k+1}, \ \ \ \ Var(Y) = \frac{c(N+1)}{(k+2)(k+1)^2} \left[ (N-k)(k-c+1) \right]
$$ respectively.
For the case mentioned above, we would derive the following distribution:
# Negative Hypergeometric distr and USDT
# (c) 2023 by QuantAtRisk

import numpy as np
import scipy
import pandas as pd
from matplotlib import pyplot as plt


def newton(n,k):
    return scipy.special.binom(n, k)

def probNHD(y, N, k, c):
    return newton(y-1, c-1) * newton(N-y, k-c) / newton(N, k)

def momentsNHD(N, k, c):
    EY = c*(N-1)/(k+1)  # the expected value
    VarY  = (c*(N+1)/((k+2)*(k+1)**2.)) * ((N-k)*(k-c+1))  # the variance
    return EY, VarY

# Case Study
N, k, c = 500, 50, 10

yrange = range(c, N-(k-c))
pr = [probNHD(y, N, k, c) for y in yrange]

m, v = momentsNHD(N, k, c)

plt.figure(figsize=(8,4), dpi=77)
plt.plot(yrange, pr, label='N, k, c = 500, 50, 10')
plt.grid(); plt.ylabel('Probability'); plt.legend(fontsize=11)
plt.xlim([10,200]); plt.xlabel('$y$', fontsize=11)
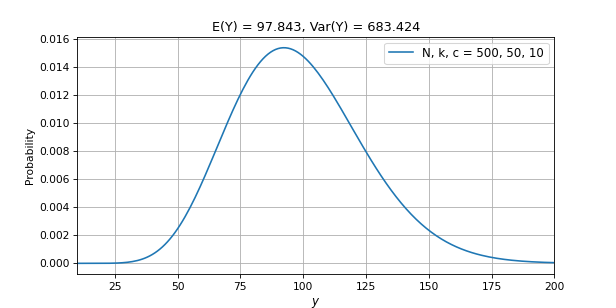
The results suggest that on average we should find all 10 special items in a little less than 100 attempts. So how this relates to stablecoins? Let’s find out!
2. In Search for Tether’s USD Perfect Peg
The abovementioned theory seems to pave an appealing way to finding the probability distribution of a perfect 1:1 peg being observed in USD₮/USD daily trading. A clear observer will immediately rise few questions. First of all, the number of pegs, $k$, corresponding to “special items” discussed in the previous section, remains unknown. It could be estimated based on historical records and assumed for the future time horizon as a plausible solution. It could be modelled as well.
Secondly, the number of the first $c$ detections among $k$ perfect pegs remains a free parameter. A lot size, $N$, can be associated with a time horizon expressed in any units of time. Let us assume we are going to examine daily close prices of USD₮/USD over the next 365 days. Therefore, $N=365$.
Also, let’s assume that due to rather low volatility there exist ideal conditions for the occurrence of a perfect peg but that is true for ca. 1% of cases (for 99% of time the perfect peg is not observed). In other words, there are ca. 4 days (exactly 3.65) where the perfect peg is observed. We can model such case in the following way:
# USDT model
plt.figure(figsize=(9,5), dpi=77)

N, k = 365, 4
for c in range(1, k+1):
    yrange = range(c, N-(k-c))
    pr = [probNHD(y, N, k, c) for y in yrange]
    ev = momentsNHD(N, k, c)[0]
    plt.plot(yrange, pr, label='c = %3g, E(Y) = %1.0f days' % (c,ev))

plt.title('N = %g, k = %g' % (N,k))
plt.ylabel('Probability')
plt.grid(); plt.legend(loc=1)
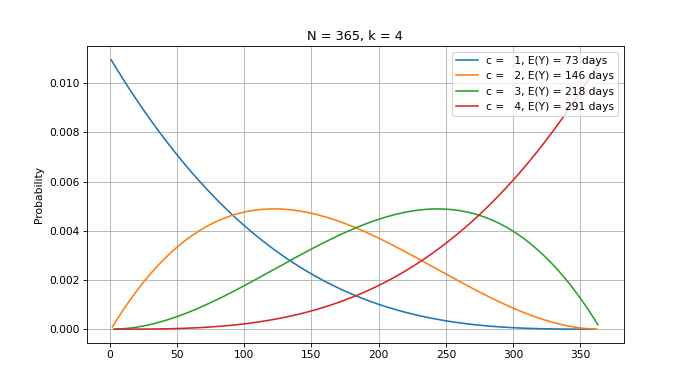
The results tells that it takes up to 60% of the calendar year to detect 3 out of 4 days displaying the perfect peg.
In order to confront the modelling results with reality, let’s have a look at crypto-market data for USD₮/USD covering the last 365 days. Daily close prices can be downloaded from Yahoo! Finance portal, available here.
# USDT/USD time-series (2022-06-21 till 2022-06-20)
df = pd.read_csv('USDT-USD.csv')
df = df.iloc[-365:,:]  # limit to the last 365 days
df.Date = pd.to_datetime(df.Date)
df.set_index('Date', drop=True, inplace=True)
df = df[['Close']]
Unfortunately, the world is not perfect. A quick search for ideal peg in the data fails:
match1 = df[df.Close == 1.0]
print(match1)
i.e.
Empty DataFrame
Columns: [Close]
Index: []
That forces us to scan the closest vicinity around the ratio of $1.0$ in order to find at least 4 days with decimal precision as close to unity as possible. We find the following empirical bracket:
match = df[(df.Close >= 0.999997) & (df.Close <= 1.000004)]
print(match)
uncovering
               Close
Date
2022-08-18  0.999999
2022-09-15  1.000003
2022-12-07  1.000002
2023-01-09  0.999999
with a temporal distribution of
plt.figure(figsize=(12,5), dpi=77)
plt.plot(df.Close)
plt.plot(match, 'xr', label='Matching values', markersize=7)
plt.grid()
plt.legend(fontsize=11)
plt.ylabel('USDT / USD', fontsize=13)
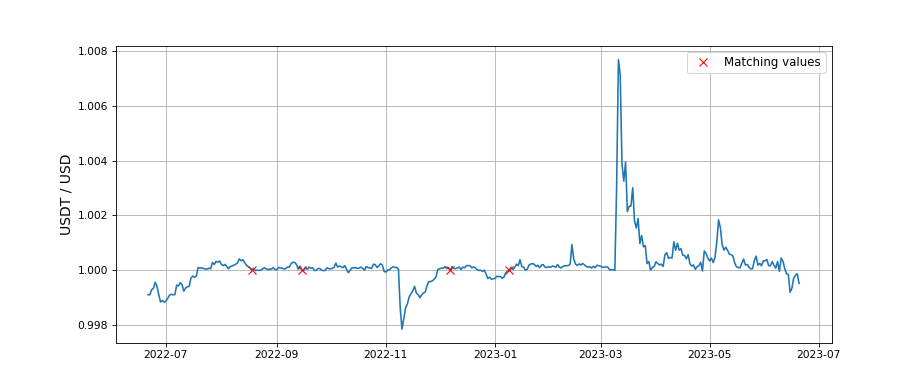
We admit the modeling drafted above was intentional from the very beginning. We knew the limiting case of 4 days observed at near $1.000000$ level of precision in the present data set. Next, we reversed the whole engineering to convince ourselves whether that can be modelled indeed and how negative hypergeometric can be applied. It turned out that this specific discrete probability function had its pinpoint application in respect even to trading data. That concludes our efforts!
References
John J. Kinney, 2009, A Probability and Statistics Companion
Jump Deeper
Volatile Vol-of-Vol: How is Volatility of Volatility calculated?
Estimating Probability of Bitcoin Pullback in its Bullish Market for Traders and Algo-Traders
The Longest Winning Bitcoin Strategy
1 comment