Since mid-July 2021 Bitcoin seems to be in its another bullish swing started at the U\$30k level, reaching U\$67k three months later. And as it happens as usual in trading, a closer inspection of a trading pattern of the asset climbing higher and higher week by week poses lots of similar questions every day. One of the most common one I have heard from traders (also speculators and “crypto investors”) could be expressed as follows: The price is skyrocketing. Should I jump in now or wait for a pullback or deeper correction?
Let’s be clear about it. The pullbacks are the part of the game. In Bitcoin trading, they are fed by a cumulative fear and triggered stop-losses. Therefore, how can we know is the next one just around the corner?
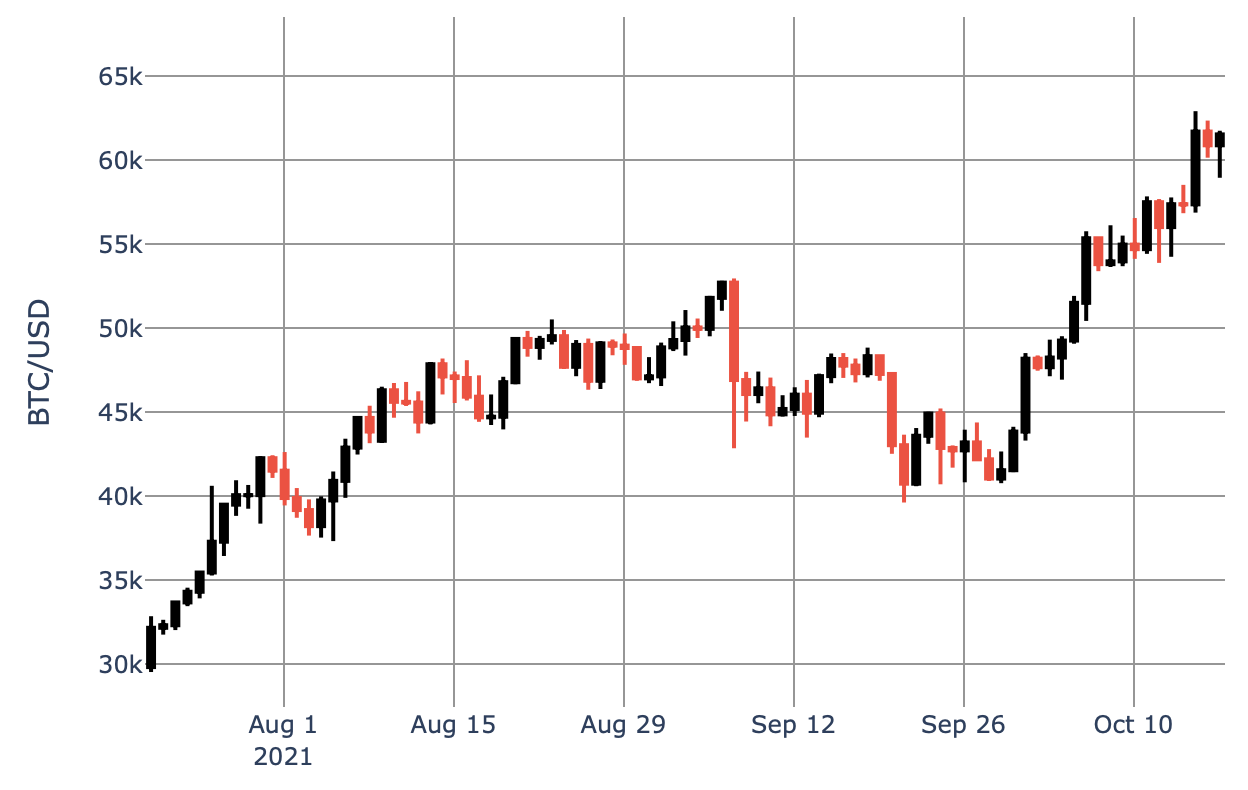
This is a typical situation presented in the following chart of daily BTC price changes. Here, the first and the last candle correspond to Jul 21 and Oct 17 2021 2:00 AM GMT+2, respectively.
In fact, many traders observe such situation regardless of the timescale although we need to keep in mind that trading at the minute and daily timescales can be governed by distinct incentives!
Various books talking about a technical analysis for trading stocks suggest that in the bullish market (like the one above for Bitcoin), if the close price remains at the same level for a couple of days – it builds the “base”. There is no determined direction in trading during this time, i.e. a subtle balance between demand and supply for the stock is maintained, however, with a “higher” probability of the price breakthrough up rather than down. And the same books provide ample examples how it worked in the past.
So, it’s Oct 17th, you look at the price chart of BTCUSD and standing face-to-face with a dilemma: Should I buy BTC “now” and if so will it make its way up over the next couple of days allowing you to earn +3% or +5%? If I knew it every time when I look at the chart, you would probably meet me today in Bahamas enjoying my early retirement. Let’s be honest. We simply cannot be 100% sure every time. However, we can try to estimate the probability of the price rising over next $k$ days before sharply pulling back. Let’s see how can we do it, next.
1. Waiting for the First Pullback
A series of daily Bitcoin returns can be considered as a series of outcomes of an experiment where BTCUSD closing higher than a day before can be assigned as a success (S), otherwise as a failure (F). We call this experiment bionomial since, at each trial, the result is one of two outcomes (S or F). At this point, however, we need to make two further assumptions: (a) the trials are independent and (b) the probabilities of success or failure remain constant from trial to trial.
In case of Bitcoin, it may seem that the first assumption is easily violated. When you observe a long sequence of price closing higher and higher over a period of, say, $k\ge 10$ days, it is highly unlikely that they are “independent”, right? This is driven by our gut feeling and often we do not realise that statistically it is possible. It can be verified by the use of Walsh–Hadamard Transform and Tests for Randomness of Financial Return-Series that the daily close prices-series of BTC/USD since Jan 1, 2015 passes all underlying tests indicating the independence (or randomness in the return-price series). As for the second assumption, we will discuss it a bit further down.
Let $P(S)=p$ and $P(F)=q=1-p$ for each trial. For $n$ independent trials (next $n$ days), let $X$ denote the number of Bitcoin close prices to be higher than a day ago (S), then the probability that it will happen on day $d$ is given by binomial probability distribution:
$$
P(X=d) = \binom{n}{d} p^d q^{n-d} \ \ \ \mbox{for} \ \ \ d=0,1,2,…,n \ .
$$ Now, let us assume the binomial presumptions but relax a condition to have a fixed number of trials. Instead, we fix the number of failures and then the number of trials becomes the random variable. So for a sequence of sample points like $\{S, SF, SSF, SSSF, … \}$ the corresponding probabilities are $\{p, pq, p^2q, p^3q, … \}$ for a number of trials $\{1, 2, 3, 4, … \}$. Let again use the symbol of $X$ but now to denote the number of trials necessary to achieve the first pullback in Bitcoin price (F). It is obvious that since we must have $d-1$ successes followed by a failure, the probability of the first pullback is:
$$
P(X=d) = p^{d-1} q \ \ \ \mbox{for} \ \ \ d=0,1,2,…
$$ where the values for $X$ now have no upper bound. This is also known as a geometric probability distribution.
2. Waiting for the Second Pullback
We might consider a case when we will wait for the second day when the Bitcoin suffers another pullback. Based on the above, it is clear that among the first $x-1$ trials, we must to have exactly one pullback (F). This can be illustrated as follows. For a sequence of sample points like $\{FF, SFF, SSFF, SSSFF, SSSFSF, … \}$ the probabilities are $\{q^2, pq^2, p^2q^2, p^3q^2, p^4q^2, … \}$ for a number of trials $\{2, 3, 4, 5, 6, … \}$. We may conclude that if the second pullback occurs at the $d$th trial (day), then the first $d-1$ trials must contain exactly one pullback and this is followed by the second pullback when the experiment ends. Note that we are not necessarily waiting here for two pullbacks in a row though it is one possibility as well. Therefore, the probability of the occurrence of the second pullback given the first one was recorded is:
$$
P(X=d) = \binom{d-1}{1} p^{d-2}q \cdot q
$$ or
$$
P(X=d) = \binom{d-1}{1} p^{d-2} q^2\ \ \ \mbox{for} \ \ \ d=2, 3, 4, … \ .
$$
3. Waiting for the $r$th Pullback
The above consideration can be generalised for the case of waiting for the $r$th pullback in Bitcoin trading over next $d$ days. If on the $r$th day the price drops down again, the the previous $d-1$ days must contain exactly $r-1$ of pullbacks by a binomial process and in addition the $r$th pullback occurs on the $d$th day. Therefore, the probability of the $r$th pullback is given by:
$$
P(X=d) = \binom{d-1}{r-1} p^{d-r} q^r\ \ \ \mbox{for} \ \ \ d= r, r+1, r+2, … \ .
$$ As an illustration, have a look at the BTC/USD chart again. The first sequence (starting on Jul 21) of the price rising for 10 days in a row is followed by 4 consecutive days of pullbacks starting on Jul 31 and ending on Aug 3. Therefore, from a standpoint of a trader wondering on Jul 20 what to do, the probability of ending up in situation displayed on Aug 3,
$$
\{ SSSSSSSSSSFFFF \} \ ,
$$ i.e. exactly two weeks later, is
$$
P(X=14) = \binom{10+4-1}{4-1} p^{10+4-4} q^4 = \binom{13}{3} p^{10} q^4 \ \ .
$$
4. Bitcoin Price Steeply Rises before It Sharply Pulls Back
The abovementioned example is a great example of this. However, we can go one step further. Keeping $p$ as a probability of price rises in the following trials and maintaining the count of S and F as we did previously, we would like to know the probability of the event to have $a$ success before $b$ failures. In other words, if the event is to occur, there must be the $a$th price hike (S) on the last trial and this must be preceded by at most $b$ days with a price falling (closing lower than on the previous day). If we let $x$ to denote number of pullbacks (F) then the random variable $d$ must be $0,1,2,…$ or $b$. The pullbacks must occur in the first $a-1+d$ trials (days). If the last day is the price closing higher than a day ago, then, of the preceding days, exactly $a-1$ must be prices rises and $d$ must be pullbacks where again $d$ is at most $b-1$.
It has been shown that such probability can be estimated as:
$$
P(a\ \mbox{price rises before}\ b\ \mbox{pullbacks}) = \sum_{d=0}^{b-1} p^aq^d \binom{a-1+d}{d} \ .
$$ Of course, the words steeply and sharply used in this section’s header have nothing to do with probabilities. They are more for marketing the product of this probability estimation. I hope you have noticed that!
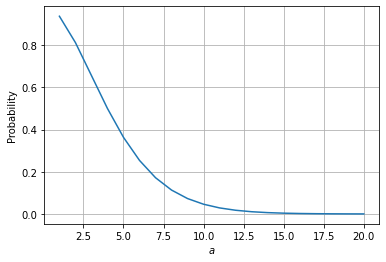
An interesting observation here is the fact that if we allow to fix $b$ at the certain level, e.g. $b=4$, then we can find:
$$
P(a\ \mbox{price rises before}\ 4\ \mbox{pullbacks}) = \sum_{d=0}^{3} p^aq^d \binom{a-1+d}{d} \ .
$$ If we assume that $p=0.5$ then we can plot in Python the above probability distribution in the following way:
from scipy.special import binom as newton
import matplotlib.pyplot as plt

def prob(a, b, p):
    s = 0
    for x in range(b-1+1):
        s = s + (p**a * (1-p)**x * newton(a-1+x, x))
    return s

pv = list()
for a in range(0, 21):
    pv.append(prob(a, b=4, p=0.5))

plt.plot(np.arange(0, 21), pv, '-')
plt.ylabel('Probability'); plt.xlabel('$a$')
plt.grid()
what reveals
Referring to the illustration mentioned in Sect. 3, we can find that for $a=10$ and $b=4}, the probability to have 4 consecutive pullback before 10 consecutive prices rises is:
prob(a=10, b=4, p=0.5)
or $4.61\%$ while
$$
P(X=14) = \binom{13}{3} p^{10} q^4 =
$$ to
newton(13,3) * 0.5**10 * 0.5**4
or $1.75\%$ and it’s lower. The former in not surprising as it presents a specific case and not any combination as discusses in Sections 1-3.
5. Estimation of $p$ for Bitcoin
At the beginning I promised we would return to the second assumption, i.e. the probabilities of success (Bitcoin price rises) or failure (Bitcoin price falling) remain constant from trial to trial. It implies the use of $P(S) = p$ and $P(F) = 1-p$ and $p$ needs to be known. Looking at the history of trading of BTC/USD, the crypto-asset witnesses lots of oomhps and dumps. Did they equal in quantity. It’s possible but we might check it.
The best way to estimate $p$ for Bitcoin is to make use of, e.g. BTC/USD daily close price-series, convert it to daily return-series covering the last $N$ days of trading, and count the total number of days with positive (not-negative and non-zero) returns divided by $N-1$ days. For instance:
import ccrypto as cc

# download a daily BTCUSD OHLC time-series from the Internet
data = cc.getCryptoSeries('BTC', freq='d', ohlc=True, exch='Coinbase')
data = data[data.index >= '2015-01-01']  # filtering for good data

# convert price-series to return-series (close prices)
ret = data.BTCUSD_C.pct_change().dropna()

# count number of days, number of days with positive and negative (zero) returns
n, np, nn = ret.count(), ret[ret > 0].count(), ret[ret <= 0].count()

# the estimation of probability of P(S) = p
est_p = np / n
est_q = 1 - est_p

print(n, np, nn, est_p, est_q)
The estimation of $p$ based on price-series commencing on Jan 1, 2015 and counting 2484 days (as of Oct 28, 2021) is
2483 1344 1139 0.5412807088199758 0.4587192911800242
or
$$
p = 54.128\%
$$ which not far way from $0.5$ that we assumed in our above considerations.
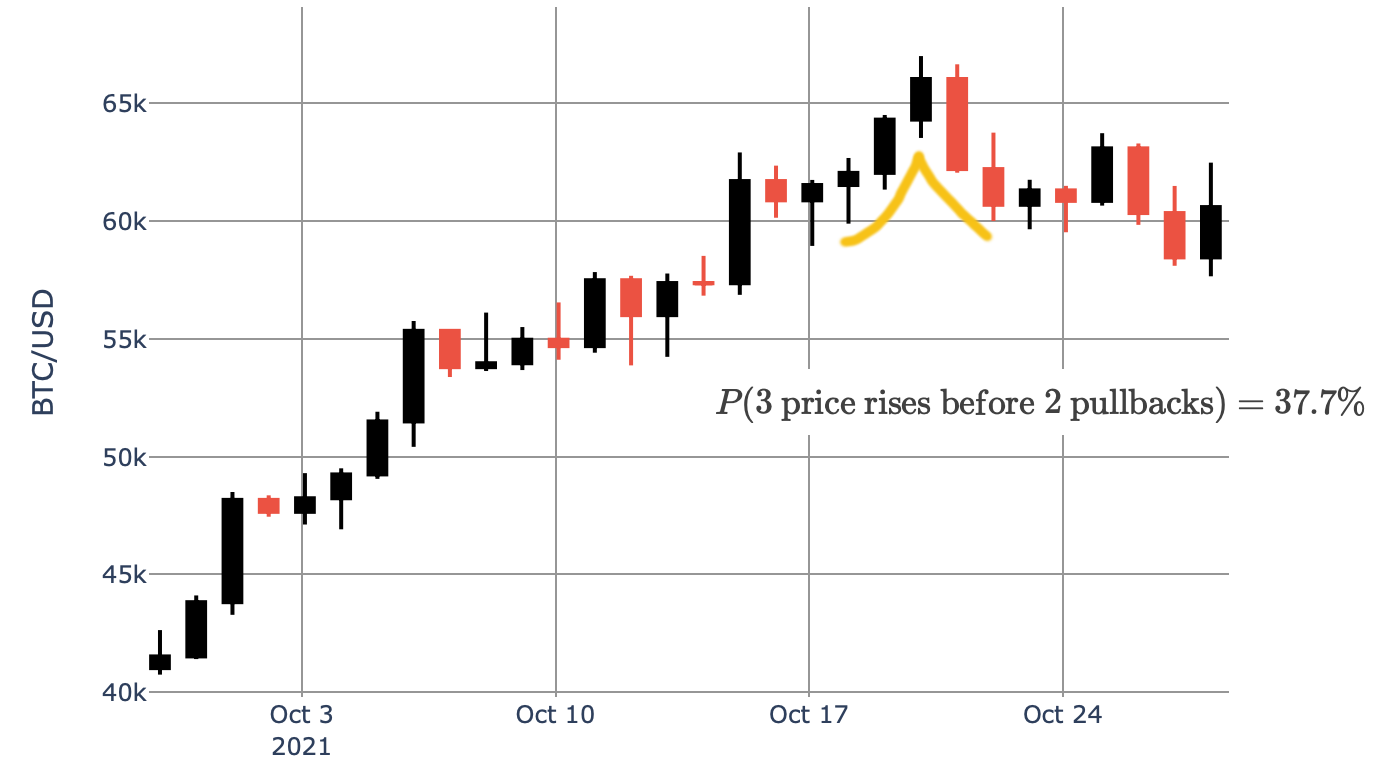
6. It’s Oct 17, 2021. Do you buy Bitcoin?
Our price chart ends on Oct 17. It time to make a decision. You buy (i.e. open a long position in BTC/USD) or you wait? You inspect the chart again. The price was surging since Sep 29 like crazy. Now it stopped at U\$61.5k. The volume of trading still increase. The price might still rise – you think. You hope it will keep climbing up for next three days and then may start falling. You estimate the probability of this situation to be:
$$
P(d=4) = p^{4-1} q = p^3 (1-p) = 7.275\%
$$ or for more aggressive pullback:
$$
P(3\ \mbox{price rises before}\ 2\ \mbox{pullbacks}) = \sum_{d=0}^{2-1} p^3q^d \binom{2+d}{d} \ .
$$
This is what happened next:
Did you buy or not? :)
References
John J. Kinney; 2009, A Probability and Statistics Companion,
A John Wiley & Sons, Inc. Publication
Jump Deeper
The Longest Winning Bitcoin Strategy
Best Crypto to Invest In: The Rules
Introduction to Sell-Off Analysis for Crypto-Assets: Triggered by Bitcoin?
Does It Make Sense to Use 1-Hour 1% VaR and ES for Bitcoin?
1 comment