Welcome to a brand new era of “financial assets” – the crypto-assets. The impossible became possible. Yes, now you can trade cryptocurrencies: money that have been created in a virtual world with a physical impact onto our everyday cash-in-the-bank reality. The grande picture is still enigmatic for majority of us. Not too many have even heard of cryptocurrencies different than bitcoin (BTC). And believe me, there are over a thousand currencies created out there!
The global characteristics of cryptocurrencies remain the same as in case of any other tradable financial assets: the coin price (expressed in, e.g., USD), OHLC, Market Cap, Volume, etc. They are traded at over 2700 crypto-markets and everyone can “invest” a bit in any coin at any moment. The most famous trait of all cryptocurrencies is volatility. It may be rapid, unpredictable, and dangerous. It can make you rich before the noon, and poor before the sundown. The risk levels associated with crypto-trading are correlated with the levels of adrenaline. Simply, the more the merrier!
With this post, we commence a series of articles at QuantAtRisk regarding the quantitative aspects of cryptocurrencies: time-series analysis, statistical properties, understanding and use of volatility, crypto-portfolios, and foundations of crypto-market risk analysis, to name just a few. It is logical to kick off our crypto-journey from the most fundamental problem, i.e. downloading cryptocurrency time-series.
1. Cryptocurrencies
Without checking, it must be obvious that Bitcoin should dominate the cryptocurrency market. It’s number one. At least as for the moment of writing these words. For all newcomers to cryptocurrencies, CryptoComapre.com API is the starting point serving as the most reliable data feed. Very frequently updated, the site serves a time-lag and timeout free gateway to build a plugin for cryptocurrency time-series download and updates.
Let me first, using Python 3.6, build a code for fetching database and extracting the most current list of crypto-coins:
# Extracting a full list of Cryptocurrencies
# (c) 2017 QuantAtRisk.com, by Pawel Lachowicz

import json
from bs4 import BeautifulSoup
import requests

url = "https://www.cryptocompare.com/api/data/coinlist/"
response = requests.get(url)
soup = BeautifulSoup(response.content, "html.parser")
data = json.loads(soup.prettify())
data = data['Data']

print(data)  # display the content
where the inner data structure is contained in a Python dictionary, e.g.:
{'SWIFT': {'Algorithm': 'Scrypt',
  'CoinName': 'BitSwift',
  'FullName': 'BitSwift (SWIFT)',
  'FullyPremined': '0',
  'Id': '4616',
  'ImageUrl': '/media/20446/swift.png',
  'Name': 'SWIFT',
  'PreMinedValue': 'N/A',
  'ProofType': 'PoW/PoS',
  'SortOrder': '210',
  'TotalCoinSupply': '4000000',
  'TotalCoinsFreeFloat': 'N/A',
  'Url': '/coins/swift/overview'},
 'AM': {'Algorithm': 'X13',
  'CoinName': 'AeroMe',
  'FullName': 'AeroMe (AM)',
  'FullyPremined': '0',
  'Id': '5330',
  'ImageUrl': '/media/20191/am.png',
  'Name': 'AM',
  'PreMinedValue': 'N/A',
  'ProofType': 'PoW/PoS',
  'SortOrder': '298',
  'TotalCoinSupply': '12000000',
  'TotalCoinsFreeFloat': 'N/A',
  'Url': '/coins/am/overview'},
 'XPOKE': {'Algorithm': 'X13',
  'CoinName': 'PokèChain',
  'FullName': 'PokèChain (XPOKE)',
  'FullyPremined': '0',
  'Id': '25817',
...
filtered as follows:
crypto_lst = sorted(list(d.keys()))
print(crypto_lst)
return the desired list of 1099 cryptocurrencies:
['007',
 '1337',
 '1CR',
 '1ST',
 '2015',
 '2BACCO',
 '2FLAV',
 '2GIVE',
 '32BIT',
 '365',
 '404',
 '42',
 '611',
 '808',
 '888',
 '8BIT',
 'ABY',
 'AC',
 'ACES',
 'ACID',
...
If you would like to check any of them, their “deeper” meaning, origin, price, etc., you may directly use CoinMarketCap.com site. For example, for ACES coin a full path would be coinmarketcap.com/currencies/aces/ whereas for the famous coin of Ethereum (ETH) coinmarketcap.com/currencies/ethereum/.
For CoinMarketCap.com, their webpages referring to different cryptocurrencies are often not named after the coins’ tickers, therefore the best way to check the coin of your choice is by the use of “Search” within the portal. Please also note that the service lists only 670 cryptocurrencies out of 1099 found above.
2. Cryptocurrencies by Market Cap
Selecting the most outstanding cryptocurrencies among all currently traded can be done by sorting them according to market capitalisation (Market Cap). In Python, we achieve that in a quite similar way as previously, however employing pandas library to store the data in an elegant form:
# Getting a List of Cryptocurrencies sorted by their most current Market Cap
# (c) 2017 QuantAtRisk.com, by Pawel Lachowicz

import pandas as pd
import json
from bs4 import BeautifulSoup
import requests

url = "https://api.coinmarketcap.com/v1/ticker/"
response = requests.get(url)
soup = BeautifulSoup(response.content, "html.parser")
dic = json.loads(soup.prettify())

# create an empty DataFrame
df = pd.DataFrame(columns=["Ticker", "MarketCap"])

for i in range(len(dic)):
    df.loc[len(df)] = [dic[i]['symbol'], dic[i]['market_cap_usd']]

df.sort_values(by=['MarketCap'])
# apply conversion to numeric as 'df' contains lots of 'None' string as values
df.MarketCap = pd.to_numeric(df.MarketCap)
The above code returns 745 crypto-tickers with 159 coins for which the Market Cap is not given. The most noticeable players on the crypto-markets we get by, for example, selecting those cryptocurrencies of the Market Cap $>$ USD 20,000,000 as follows:
P = df[df.MarketCap > 20e6]
print(P, end="\n\n")

portfolio = list(P.Ticker)
print(portfolio)
returning 22-CryptoAsset Portfolio for any further analysis:
   Ticker     MarketCap
0     BTC  1.705305e+10
1     ETH  3.973785e+09
2    DASH  7.622590e+08
3     XMR  3.316541e+08
4     XRP  2.596926e+08
5     LTC  2.010260e+08
6     ETC  1.751197e+08
7     XEM  1.405557e+08
8     REP  9.143574e+07
9    MAID  7.681489e+07
10    ZEC  6.815703e+07
11  STEEM  4.548400e+07
12   USDT  4.496660e+07
13    GNT  4.185354e+07
14    FCT  3.047311e+07
15    ICN  3.017099e+07
16    DGD  3.010240e+07
17  WAVES  2.829620e+07
18    DCR  2.664736e+07
19    LSK  2.542265e+07
20   DOGE  2.484724e+07
21   PIVX  2.114941e+07

['BTC', 'ETH', 'DASH', 'XMR', 'XRP', 'LTC', 'ETC', 'XEM', 'REP',
'MAID', 'ZEC', 'STEEM', 'USDT', 'GNT', 'FCT', 'ICN', 'DGD',
'WAVES', 'DCR', 'LSK', 'DOGE', 'PIVX']
Given the list of tickers, the remaining and final step is fetching online data and time-series construction. Again, we will use CryptoComapre.com and its full documentation to build a Python code allowing us to perform that task.
3. Daily Historical Cryptocurrency Time Series
Similarly to Yahoo! Finance or Google Finance APIs allowing for OHCL price-series download for US stock, CryptoComapre.com API equips us with the right tools to make this highly sought solution easily accessible by anyone. For daily sampled time-series the timestamp should be set in GMT timezone however you should check the results to be doubly sure, e.g. using the functions defined below, that we use anyway:
# Downloading daily price-series OHCL for Cryptocurrencies
# (c) 2017 QuantAtRisk.com, by Pawel Lachowicz

import numpy as np
import pandas as pd
from matplotlib import pyplot as plt
from datetime import datetime
import json
from bs4 import BeautifulSoup
import requests


def timestamp2date(timestamp):
    # function converts a Unix timestamp into Gregorian date
    return datetime.fromtimestamp(int(timestamp)).strftime('%Y-%m-%d')

def date2timestamp(date):
    # function coverts Gregorian date in a given format to timestamp
    return datetime.strptime(date_today, '%Y-%m-%d').timestamp()


def fetchCryptoOHLC(fsym, tsym):
    # function fetches a crypto price-series for fsym/tsym and stores
    # it in pandas DataFrame

    cols = ['date', 'timestamp', 'open', 'high', 'low', 'close']
    lst = ['time', 'open', 'high', 'low', 'close']

    timestamp_today = datetime.today().timestamp()
    curr_timestamp = timestamp_today

    for j in range(2):
        df = pd.DataFrame(columns=cols)
        url = "https://min-api.cryptocompare.com/data/histoday?fsym=" + fsym +
              "&tsym=" + tsym + "&toTs=" + str(int(curr_timestamp)) + "&limit=2000"
        response = requests.get(url)
        soup = BeautifulSoup(response.content, "html.parser")
        dic = json.loads(soup.prettify())
        for i in range(1, 2001):
            tmp = []
            for e in enumerate(lst):
                x = e[0]
                y = dic['Data'][i][e[1]]
                if(x == 0):
                    tmp.append(str(timestamp2date(y)))
                tmp.append(y)
            if(np.sum(tmp[-4::]) > 0):
                df.loc[len(df)] = np.array(tmp)
        df.index = pd.to_datetime(df.date)
        df.drop('date', axis=1, inplace=True)
        curr_timestamp = int(df.ix[0][0])
        if(j == 0):
            df0 = df.copy()
        else:
            data = pd.concat([df, df0], axis=0)

    return data
The loop over $j$ runs only two times. This is dictated by the maximal number of data rows (equal to 2000) the service allows to download at one time. For daily price-series, 4000 dates back to a year of approx. 2010 when the Bitcoin (BTC) and other cryptocurrencies were born.
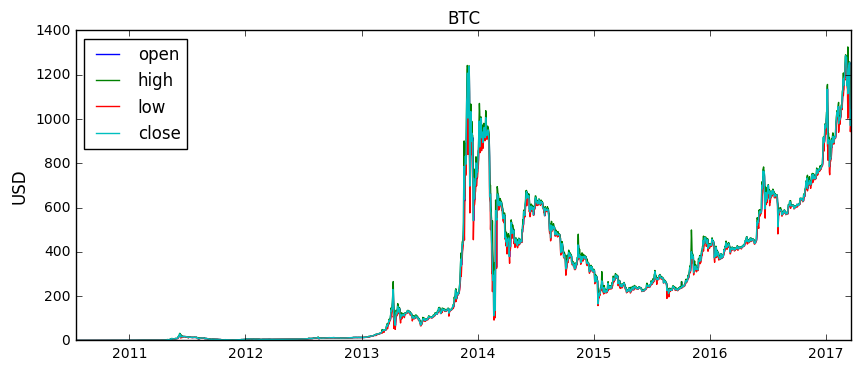
We use the code for fetching BTC vs USD as follows:
fsym = "BTC"
tsym = "USD"
data = fetchCryptoOHLC(fsym, tsym)

# print the BTC/USD OHLC price-series
print(data)

# plot them all
plt.figure(figsize=(10,4))
plt.plot(data.open)
plt.plot(data.high)
plt.plot(data.low)
plt.plot(data.close)
plt.legend(loc=2)
plt.title(fsym, fontsize=12)
plt.ylabel(tsym, fontsize=12)
returning:
             timestamp     open     high      low    close
date
2010-07-17  1279324800  0.04951  0.04951  0.04951  0.04951
2010-07-18  1279411200  0.05941  0.08585  0.05941  0.08584
2010-07-19  1279497600   0.0909  0.09307  0.07723   0.0808
2010-07-20  1279584000  0.08181  0.08181  0.07426  0.07474
2010-07-21  1279670400  0.07425  0.07921  0.06634  0.07921
2010-07-22  1279756800  0.07921  0.08181   0.0505   0.0505
2010-07-23  1279843200   0.0505  0.06767   0.0505  0.06262
2010-07-24  1279929600  0.06161  0.06161  0.05049  0.05454
2010-07-25  1280016000  0.05545  0.05941   0.0505   0.0505
2010-07-26  1280102400     0.05    0.056     0.05    0.056
2010-07-27  1280188800    0.053   0.0605    0.053     0.06
2010-07-28  1280275200     0.06    0.062    0.054   0.0589
...
2017-03-12  1489276800  1177.28   1233.7  1172.83  1225.39
2017-03-13  1489363200  1225.39  1245.95  1211.97   1238.5
2017-03-14  1489449600   1238.5  1255.87   1223.5  1244.14
2017-03-15  1489536000  1244.14   1257.9  1242.32  1254.82
2017-03-16  1489622400  1254.82  1257.74  1131.42   1171.5
2017-03-17  1489708800   1171.5  1172.49  1069.09  1071.29
2017-03-18  1489795200  1071.29  1097.77    942.8   970.34
2017-03-19  1489881600   970.34  1059.88   970.34  1020.36
2017-03-20  1489968000  1020.36  1054.78  1015.54  1038.76